
Active investors with $100,000 to deploy face a fundamental strategicinvestment property return calculations decision that shapes their portfolio’s long-term trajectory: prioritize cash flow or appreciation? This choice determines which markets you target, what property types you pursue, how you structure financing, and ultimately whether your portfolio generates immediate income or builds substantial net worth over decades. Most importantly, the cash flow versus appreciation decision affects your financial flexibility, risk tolerance requirements, and timeline to financial independence.
The tension between cash flow real estate and appreciation real estate isn’t merely academic—it directly impacts your monthly lifestyle, tax strategy, refinancing capabilities, and exit options when market cycles turn. Cash flow markets in the Midwest and South offer immediate 8-12% cash-on-cash returns but historically appreciate 2-4% annually. Appreciation markets in coastal regions and major metros generate minimal or negative cash flow initially but deliver 5-8% annual appreciation creating substantial equity over time.
Understanding when to prioritize each strategy, how to balance both approaches within diversified portfolios, and which financing structures optimize different investment goals separates sophisticated active investors from those who chase returns reactively without coherent strategy. This guide analyzes cash flow real estate versus appreciation real estate across multiple dimensions—market selection, property types, financing impact, tax implications, and portfolio construction—helping you deploy your next $100,000 strategically rather than emotionally.
Key Summary
This comprehensive analysis explains the fundamental differences between cash flow and appreciation real estate investing, helping active investors make strategic market and property selection decisions.
In this guide:
- How cash flow and appreciation strategies generate wealth through fundamentally different mechanisms and timelines (real estate investment strategies)
- Which markets and property types deliver superior cash flow versus appreciation and why geographic selection matters enormously (real estate market analysis)
- How to calculate true returns accounting for both cash flow and appreciation components using comprehensive metrics (investment property return calculations)
- When to prioritize each strategy based on your financial situation, timeline, and risk tolerance preferences (portfolio construction strategies)
Cash Flow Real Estate vs Appreciation Real Estate: Understanding the Fundamental Difference
Cash flow real estate and appreciation real estate represent distinct wealth-building approaches optimizing for different financial outcomes through divergent property selection, market targeting, and operational strategies. Understanding these fundamental differences prevents strategic confusion where investors unknowingly pursue contradictory objectives simultaneously.
Cash flow real estate prioritizes immediate income generation through monthly rental collections exceeding all operational expenses including mortgage payments, taxes, insurance, maintenance, vacancies, and management fees. Properties generating positive cash flow from day one provide immediate financial benefits—supplementing income, funding additional acquisitions, or supporting lifestyle expenses without requiring property sales. Typical cash flow properties in markets like Indianapolis, Memphis, or Birmingham might purchase for $150,000-$200,000, rent for $1,500-$1,800 monthly, and generate $300-$500 monthly cash flow after all expenses.
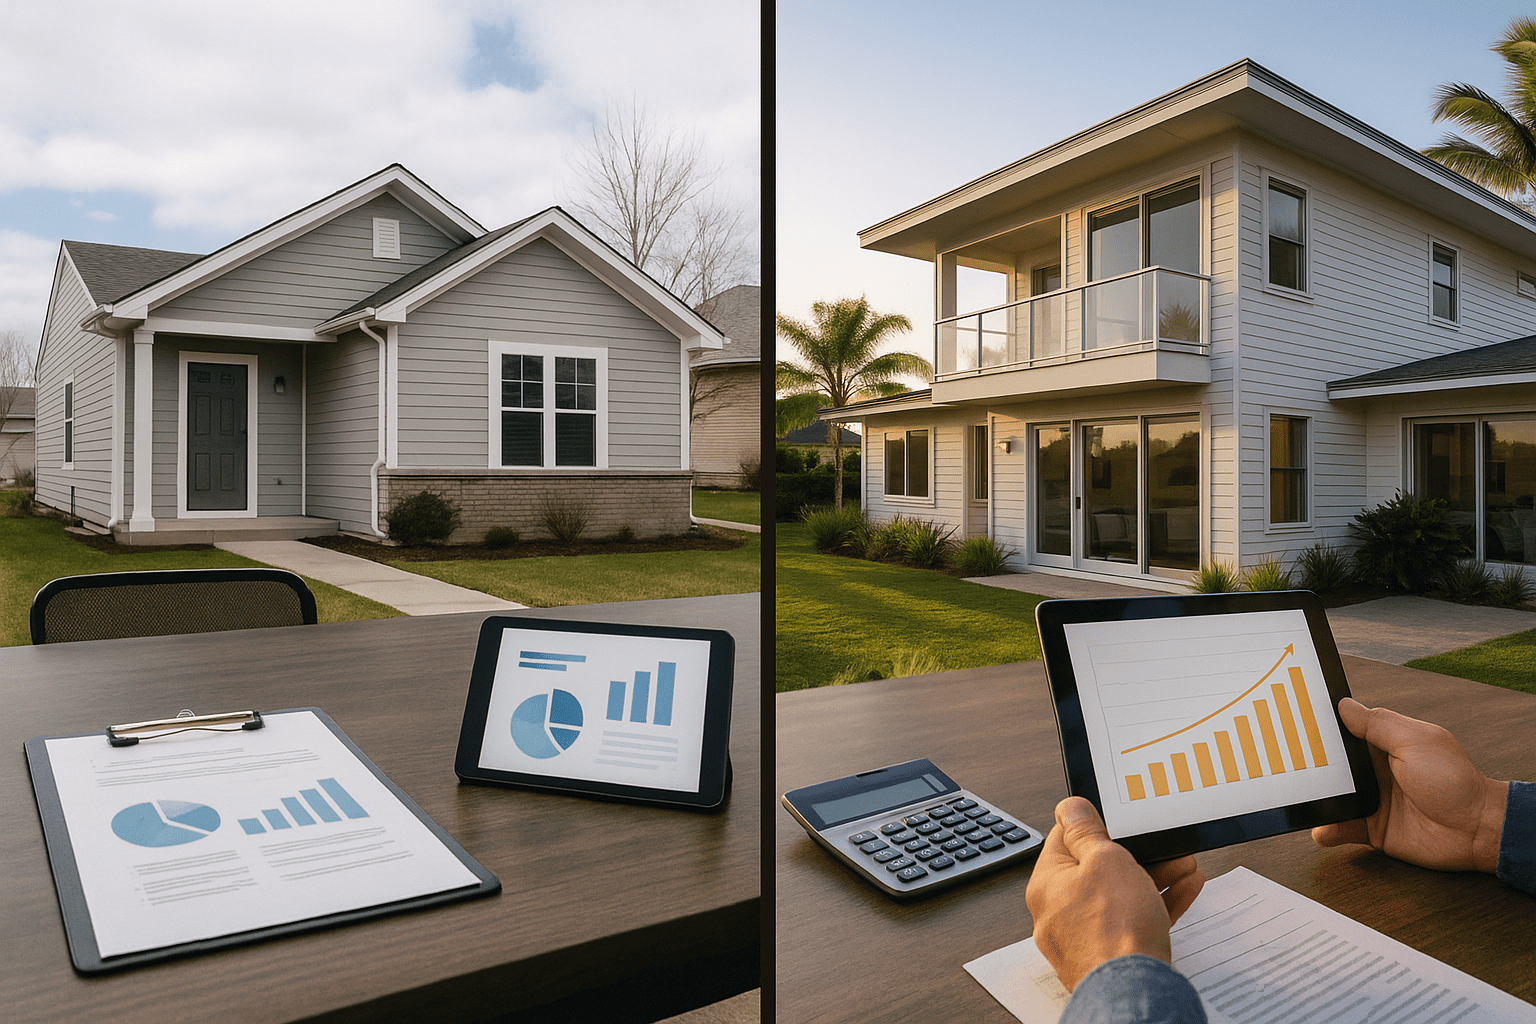
Appreciation real estate emphasizes long-term equity growth through property value increases driven by market demand, economic growth, job creation, and constrained housing supply. These properties often generate minimal or negative cash flow initially because high acquisition costs in desirable markets create monthly expenses exceeding rental income even at market rents. A property in Austin, Denver, or Seattle might purchase for $500,000, rent for $3,200 monthly, and produce negative $200-$400 monthly cash flow initially—but appreciate 6-8% annually creating $30,000-$40,000 in equity gains.
The wealth creation mechanism differs fundamentally between strategies. Cash flow real estate builds wealth primarily through income accumulation—$500 monthly cash flow generates $6,000 annually in accessible funds you can spend, reinvest, or save. Over 10 years with modest 3% appreciation, a $200,000 property generates $60,000 in cash flow plus approximately $68,000 in equity from appreciation and mortgage paydown, totaling $128,000 in wealth creation. This approach provides liquidity and flexibility because monthly income flows continuously regardless of whether you sell properties.
Appreciation real estate builds wealth through forced savings and compounding equity growth. That same $100,000 invested in appreciation markets might purchase fewer properties—perhaps a single $500,000 property with 20% initial capital—but appreciation at 7% annually creates $350,000 in equity over 10 years plus approximately $100,000 in mortgage paydown through tenant payments. Total wealth creation reaches $450,000, but this wealth remains illiquid until you sell or refinance, providing no monthly income during the accumulation period.
Risk profiles differ significantly between approaches. Cash flow real estate provides downside protection through immediate income covering expenses—even if appreciation stalls or reverses, positive cash flow sustains operations indefinitely. Properties generating $500 monthly cash flow can weather extended vacancies, unexpected repairs, and market downturns without forcing sales at unfavorable prices. This defensive characteristic makes cash flow strategies appropriate for conservative investors, those approaching retirement, or anyone requiring predictable income.
Appreciation real estate exposes investors to market cycle risk and carrying cost pressure. Properties with negative or minimal cash flow require constant capital infusion to cover monthly shortfalls—if you can’t sustain these payments during job loss, market downturns, or personal financial stress, you’re forced to sell potentially at losses. However, appreciation properties also provide upside leverage where 20% initial capital controls 100% of appreciation—a $500,000 property appreciating $40,000 annually generates 40% returns on your $100,000 investment through equity multiplication.
Tax treatment affects both strategies but manifests differently. Cash flow real estate generates taxable rental income reduced by operational expenses, interest, and depreciation deductions. Properties with strong cash flow often show paper losses despite positive cash distributions because depreciation and other deductions exceed taxable income. Appreciation real estate’s minimal cash flow generates less immediate tax liability—paper losses from negative cash flow often offset other income—but creates larger capital gains when selling. Calculate after-tax returns for both strategies using your marginal tax rate to understand true wealth creation.
Financing structures interact with strategy selection significantly. Properties generating strong cash flow qualify easily for DSCR loans based primarily on rental income covering debt service. Appreciation properties with tight or negative cash flow struggle to meet debt coverage requirements—lenders prefer 1.25x coverage minimum—potentially requiring larger initial capital contributions or alternative bank statement loan structures based on your income rather than property performance.
Timeline to financial independence varies dramatically between strategies. Aggressive cash flow investors targeting $10,000 monthly passive income might achieve this goal with 20-25 properties generating $400-$500 each within 5-7 years through systematic acquisition and refinancing. Appreciation investors reach similar net worth through fewer properties—perhaps 5-7 high-value assets—but require longer 10-15 year timelines for appreciation compounding to build sufficient equity supporting retirement through property sales or refinancing.
Portfolio liquidity represents another crucial distinction. Cash flow portfolios generate continuous accessible income—financial benefits flow monthly without property sales. Appreciation portfolios lock wealth in illiquid real estate requiring sales or refinancing to access equity. This liquidity difference affects financial flexibility enormously: cash flow investors can weather personal financial challenges through existing income streams while appreciation investors must sell properties or maintain external income sources supporting operations until strategic sale or refinancing opportunities arise.
Best Markets for Cash Flow Real Estate: Where Monthly Income Dominates Strategy
Geographic market selection determines cash flow potential more than any other factor—even excellent property management and tenant selection can’t overcome unfavorable market fundamentals where acquisition costs exceed rental income capacity. Understanding which markets deliver superior cash flow and why these dynamics exist helps you deploy capital into locations optimizing immediate income generation.
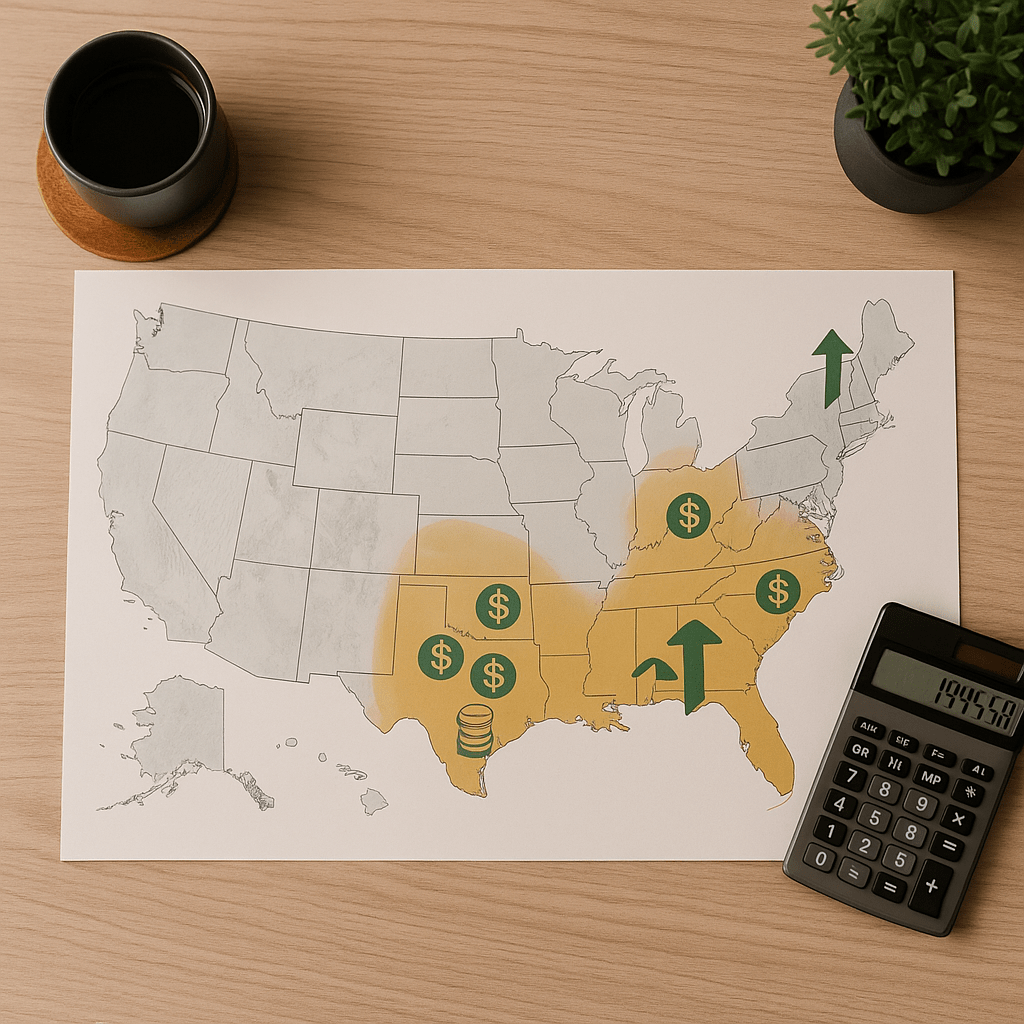
Midwest markets including Indianapolis, Cleveland, Cincinnati, Kansas City, and St. Louis consistently rank among the highest cash flow markets nationally. These metros offer median property prices between $150,000-$250,000 with rent-to-price ratios often exceeding 1% monthly—a $180,000 property rents for $1,800-$2,000 monthly generating strong positive cash flow after expenses. Economic stability through diversified job markets, reasonable property taxes, and stable tenant demand create ideal cash flow conditions despite modest 2-4% annual appreciation.
Southern markets particularly in Tennessee, Alabama, and Arkansas deliver exceptional cash flow performance. Memphis, Birmingham, and Little Rock offer purchase prices $100,000-$175,000 with monthly rents $1,200-$1,600 creating robust cash-on-cash returns frequently reaching 10-15% annually. Lower property taxes than coastal states, business-friendly regulations reducing operational costs, and growing regional economies support consistent tenant demand while maintaining acquisition costs far below coastal markets.
Rust Belt recovery markets where legacy industrial economies transition to diversified bases—cities like Pittsburgh, Buffalo, and parts of Ohio—provide compelling cash flow opportunities. Properties often purchase well below replacement cost due to historical population declines, but stabilizing economies, growing healthcare and education sectors, and renewed urban investment create tenant demand supporting positive cash flow. These markets require more careful neighborhood selection avoiding declining areas but reward diligent investors with strong immediate returns.
College town markets outside major metros combine stable tenant demand from student populations with affordable acquisition costs supporting cash flow. Cities like Bloomington (Indiana), Gainesville (Florida), or College Station (Texas) maintain consistent occupancy through academic cycles while offering purchase prices enabling positive cash flow from moderate rents. University employment provides economic stability though student tenant management requires specific operational expertise managing turnover and seasonal vacancy patterns.
The 1% rule serves as a quick cash flow screening metric: monthly rent should equal or exceed 1% of purchase price for potential positive cash flow. A $150,000 property must rent for at least $1,500 monthly to meet this threshold. Markets where median properties satisfy the 1% rule deserve detailed analysis for cash flow investments. Use our rental property calculator to model complete expense scenarios verifying positive cash flow rather than relying on the 1% rule alone, which provides only preliminary screening.
Population stability rather than rapid growth characterizes strong cash flow markets. Explosive population growth often drives appreciation but simultaneously increases acquisition costs faster than rent growth, compressing cash flow margins. Stable markets with 0-2% annual population growth and consistent job markets maintain rent-to-price ratios supporting cash flow even as modest appreciation builds equity over time.
Property tax rates dramatically affect cash flow calculations—high-tax states can eliminate otherwise positive cash flow entirely. Compare effective property tax rates when evaluating markets: Texas properties might purchase cheaply but suffer 2-3% annual property taxes consuming cash flow, while Indiana properties with 1% tax rates preserve more monthly income. Calculate net cash flow after actual local tax rates rather than assuming national averages that don’t reflect regional variations.
Insurance costs vary by region affecting cash flow significantly. Hurricane-prone markets like coastal Florida or Gulf Coast cities require expensive windstorm coverage potentially costing $2,000-$4,000 annually versus $800-$1,200 in stable climate regions. These insurance differentials of $100-$270 monthly directly reduce cash flow, sometimes converting seemingly positive returns to break-even or negative results. Factor actual insurance quotes into cash flow projections before acquiring properties in high-insurance markets.
Landlord-tenant laws affect operational efficiency and cash flow sustainability. States with landlord-friendly eviction processes—typically 30-60 days from notice to possession—allow quick resolution of non-paying tenants preserving cash flow. States requiring 90-120+ day eviction timelines create extended periods of negative cash flow during tenant problems. Research state and local landlord-tenant regulations as part of market selection since legal environment affects practical cash flow realization significantly.
When financing cash flow properties, DSCR loans based on property rental income rather than personal finances allow rapid portfolio scaling in cash flow markets. Since these properties generate income exceeding debt service by design, they naturally qualify under DSCR underwriting. Calculate debt service coverage ratios using our DSCR loan calculator before making offers, ensuring projected rents support financing you’ll need to close acquisitions.

Best Markets for Appreciation Real Estate: Where Equity Growth Drives Returns
Appreciation-focused markets share characteristics that drive sustained property value increases: strong job growth, constrained housing supply, high-income employment concentration, and desirable quality-of-life amenities attracting continuous population migration. Understanding these dynamics helps you identify markets where equity growth compensates for limited or negative cash flow.
West Coast markets including Seattle, San Francisco Bay Area, San Diego, and Los Angeles historically deliver appreciation rates averaging 5-8% annually over complete market cycles despite temporary corrections. These metros combine high-paying technology and professional service employment, geographic constraints limiting development (water, mountains, strict zoning), and international investment demand creating sustained upward price pressure. Properties might generate minimal or negative cash flow but appreciation on $800,000-$1,500,000 properties creates $40,000-$120,000 annual equity gains.
Sunbelt growth markets particularly Austin, Denver, Phoenix, and Charlotte blend strong appreciation with better cash flow characteristics than coastal markets. These cities experience rapid population growth—often 2-5% annually—driven by corporate relocations, remote worker migration, and business-friendly regulations. Property prices remain below coastal levels ($350,000-$600,000 typically) while delivering appreciation rates approaching 6-8% during growth periods. This combination of reasonable entry costs and strong appreciation creates optimal risk-adjusted returns for many active investors.
Gateway cities including New York, Boston, Washington DC, and Chicago offer appreciation stability through economic diversity, global investment appeal, and continuous high-income employment. While appreciation rates might average 3-5% annually—lower than emerging markets—these cities demonstrate remarkable resilience through economic cycles, providing predictable long-term growth with lower volatility than smaller metros. Properties in these markets require substantial capital ($400,000-$1,000,000+) but offer liquidity advantages through deep buyer pools during eventual sales.
Secondary market emergence patterns show strong appreciation potential when major metros reach affordability limits driving spillover demand to nearby cities. As Austin becomes expensive, San Antonio and Round Rock benefit from overflow. Seattle’s prices push demand toward Tacoma and Spokane. Identifying these secondary markets before broad investor recognition allows acquisition at more favorable prices while capturing subsequent appreciation as demand redirects. Monitor major metro price-to-income ratios—when ratios exceed 5-6x, watch nearby affordable alternatives for emerging appreciation.
Job market composition determines appreciation sustainability more than absolute job growth. Markets concentrating high-income professional employment in technology, finance, healthcare, and professional services support sustained appreciation through residents’ increasing purchasing power. Manufacturing or low-wage service-dependent economies struggle to generate sustained appreciation regardless of job growth because wage levels don’t support continued price increases. Analyze median household income trends and employment composition, not just headline job growth numbers.
Zoning restrictions and development constraints create supply limitations supporting appreciation regardless of demand fluctuations. Markets with restrictive zoning, strong NIMBY opposition to development, or physical constraints (water, mountains, park land) limiting expansion maintain housing scarcity supporting price growth. Research municipal zoning policies and development pipeline data—markets approving minimal new housing despite population growth deliver stronger appreciation than those welcoming extensive development.
Infrastructure investment and transit expansion often precede appreciation in specific neighborhoods or corridors. Light rail announcements, highway improvements, or major public facility developments attract demand before construction completes, allowing strategic acquisition ahead of broader market recognition. Follow municipal infrastructure plans and transit authority announcements identifying areas positioned for appreciation from improved access and public investment.
University and medical center expansion drives localized appreciation through employment concentration and revitalization investment. Major hospital expansions, university research campus development, or medical district creation generate sustained appreciation in surrounding neighborhoods. These anchor institutions provide economic stability and attract high-income professionals supporting residential demand and price growth. Monitor expansion announcements from these institutions identifying nearby acquisition opportunities before market prices reflect anticipated development.
Calculating total returns from appreciation properties requires comprehensive analysis beyond annual appreciation percentages. A property purchased for $500,000 appreciating at 6% annually generates $30,000 first-year equity gain—a 30% return on $100,000 invested capital (assuming 20% initial investment). However, negative $300 monthly cash flow costs $3,600 annually, reducing net return to approximately 26.4%. Add $7,000 annual mortgage paydown through tenant payments, and total return reaches 33.4% on invested capital despite negative cash flow. Use our investment growth calculator to model multi-year scenarios showing compound appreciation effects.
Financing appreciation properties often requires conventional loan structures since minimal cash flow struggles to meet DSCR requirements. These loans qualify based on your personal income, credit, and reserves rather than property performance, allowing acquisition of properties without immediate positive cash flow. However, conventional financing limits most borrowers to 10 financed properties—plan portfolio scaling strategies accounting for this constraint when pursuing appreciation-focused investing in conventional financing environments.
Balancing Cash Flow and Appreciation: Portfolio Construction Strategies
Sophisticated active investors rarely pursue pure cash flow or appreciation strategies exclusively—instead constructing diversified portfolios balancing both approaches optimizes overall risk-adjusted returns while providing both immediate income and long-term wealth building. Understanding how to allocate capital between strategies based on your specific circumstances determines portfolio performance through complete market cycles.
The 70/30 allocation strategy dedicates 70% of capital to cash flow properties providing stable monthly income while deploying 30% toward appreciation properties building long-term equity. This conservative approach generates sufficient immediate cash flow funding operations and lifestyle needs while participating in equity growth from appreciation markets. Investors requiring income—those approaching retirement or seeking to replace employment income—benefit from majority cash flow allocations providing financial security while maintaining appreciation exposure for wealth building.
Aggressive 40/60 appreciation-focused allocations work for younger investors with longer time horizons, high income from employment covering potential cash flow shortfalls, and higher risk tolerance accepting market volatility for superior long-term returns. Dedicating 60% of capital to appreciation properties in high-growth markets maximizes equity accumulation but requires external income sources sustaining operations if properties generate negative cash flow. This strategy accelerates wealth building during prime earning years when income supports aggressive investing.
Geographic diversification across both strategy types protects portfolios from regional market cycles affecting cash flow and appreciation differently. Own properties in 3-4 distinct markets spanning Midwest cash flow areas, Sunbelt growth markets, and perhaps one coastal appreciation market. When Texas market appreciation slows, Midwest properties continue generating reliable cash flow. If Midwest rents stagnate, Texas appreciation maintains equity growth. This diversification smooths total returns across varying regional cycles.
Progressive allocation adjustments over time align portfolio composition with changing life circumstances and financial needs. Early-career investors might start 30/70 cash flow/appreciation, building wealth aggressively through appreciation properties while working. As retirement approaches, systematically shift allocation toward 80/20 cash flow emphasis through strategic sales of appreciation properties via 1031 exchanges into cash-flowing markets, generating income replacing employment earnings. Calculate this transition using our 1031 exchange calculator to understand tax-efficient portfolio repositioning.
Property type diversification complements geographic allocation. Own primarily single-family rentals in appreciation markets where families seek quality school districts and homeownership substitutes, while holding small multifamily (2-4 units) in cash flow markets where rental demand remains strong regardless of homeownership trends. Single-family appreciation properties often sell easily to owner-occupants during exits while multifamily cash flow properties attract investor buyers seeking income regardless of market cycles.
Leverage allocation between strategies affects portfolio risk significantly. Consider using higher leverage (25% initial capital) in appreciation markets where equity growth provides safety margin against higher debt, while employing lower leverage (30-35% initial capital) in cash flow markets prioritizing immediate income over equity multiplication. This differentiated leverage approach optimizes each strategy’s strengths while moderating weaknesses. Calculate these scenarios comparing risk-adjusted returns across leverage levels understanding how debt magnifies both gains and losses.
Cash flow reinvestment strategies determine scaling velocity. Automatically reinvest all cash flow from cash flow properties into reserves and future acquisitions rather than spending income, accelerating portfolio growth substantially. Cash flow properties generating $500 monthly each provide $30,000 capital over five years across ten properties—sufficient for 2-3 additional property acquisitions funded purely through portfolio-generated income without external capital.
Capital call reserves become critical in appreciation-focused portfolios since negative cash flow properties require continuous funding. Maintain 12-24 months of negative cash flow coverage in liquid reserves for each appreciation property—if a property runs negative $300 monthly, reserve $3,600-$7,200 covering operations during unexpected circumstances. Insufficient reserves force sales at inopportune times when market cycles turn unfavorable or personal financial situations change.
When using equity from existing properties to fund new acquisitions through refinancing, allocate extracted capital strategically between strategies rather than defaulting to similar property types. If you refinance cash flow properties extracting equity, consider deploying funds into appreciation markets diversifying portfolio exposure. Conversely, refinancing appreciation properties generating substantial equity might fund cash flow acquisitions improving portfolio income generation. This deliberate cross-strategy allocation builds balanced exposure systematically.
PORTFOLIO LOAN programs specifically designed for investors holding multiple properties often provide favorable terms when refinancing entire portfolios simultaneously. These lenders understand sophisticated investors balancing cash flow and appreciation strategies, potentially offering better combined pricing than individual property refinancing. Explore portfolio financing when you own 5+ properties seeking capital for continued scaling across both strategy types.
Financing Impact on Cash Flow vs Appreciation Returns
Financing structures dramatically affect whether properties generate positive cash flow or require capital infusions, making loan selection crucial to successful strategy execution. The same property might produce excellent cash flow with one financing structure while running negative with another, independent of actual market performance or operational efficiency.
Debt service coverage ratios (DSCR) quantify how property rental income compares to monthly financing costs including principal, interest, taxes, and insurance. DSCR loans require minimum ratios typically 1.0-1.25, meaning rental income must equal or exceed monthly financing by 0-25%. Properties with strong rent-to-price ratios easily meet DSCR requirements qualifying for investment property financing based purely on property performance without requiring personal income verification.
Interest rate sensitivity affects cash flow and appreciation strategies differently. A 1% interest rate increase costs approximately $100 monthly on $100,000 financed—material to cash flow properties where this represents 20-30% of monthly profit but less impactful to appreciation properties where $100 monthly represents small percentage of $40,000+ annual equity gains. Lock favorable rates on cash flow properties prioritizing payment stability while accepting variable rates on appreciation properties where rate fluctuations matter less relative to total returns.
Loan term selection between 15, 20, and 30-year options creates significant cash flow differences. A 30-year mortgage on $160,000 at 7.5% costs approximately $1,119 monthly versus $1,481 monthly on a 15-year term—a $362 monthly difference converting positive cash flow properties into break-even or negative scenarios. Cash flow investors should default to 30-year terms maximizing monthly income, while appreciation investors might consider shorter terms accelerating equity building through faster principal paydown when monthly cash flow isn’t prioritized.
Initial capital percentage affects leverage and cash flow simultaneously. Properties purchased with 20% initial investment maximize leverage—every dollar of equity controls $5 of asset value—but also maximize monthly debt service potentially creating negative cash flow. Increasing to 30-40% initial capital reduces leverage but decreases monthly financing costs improving immediate cash flow. Model these trade-offs calculating cash-on-cash returns across various leverage levels identifying optimal structures for your specific strategy emphasis.
Adjustable-rate mortgages (ARMs) provide lower initial rates than fixed-rate products, improving early cash flow on marginal properties. A 5/1 or 7/1 ARM might start 0.5-1.0% below fixed rates, adding $50-$100 monthly cash flow during initial fixed periods. However, rate adjustment risk after fixed periods threatens to convert positive cash flow negative if rates increase substantially. Use ARMs selectively on appreciation properties you plan to sell or refinance within the fixed period, avoiding them on cash flow properties you intend holding indefinitely.
Interest-only periods on certain investment loans reduce monthly payments by 30-40% compared to fully amortizing structures, dramatically improving cash flow during interest-only terms. A $200,000 loan at 7.5% costs approximately $1,398 monthly with principal and interest versus $1,250 interest-only—a $148 monthly cash flow improvement. However, interest-only structures build no equity through principal paydown and face payment increases when amortization begins. Consider interest-only selectively for appreciation properties where equity building occurs through market appreciation rather than debt reduction.
Refinancing strategies differ between approaches based on objectives. Cash flow investors refinance primarily when rates drop substantially (1.0%+ improvements) enhancing monthly income without extracting equity, maintaining low leverage preserving cash flow. Appreciation investors refinance to extract accumulated equity deploying into additional appreciation properties, accepting potentially higher rates or payments because equity extraction for redeployment outweighs cash flow impact.
HELOC financing provides flexible capital access without disturbing existing favorable first mortgages. If you hold cash flow properties financed at 4-5% rates from previous years, maintain those loans rather than cash-out refinancing at current 7-8% rates. Instead, use HELOCs to access equity deploying into new acquisitions while preserving low-rate base financing. Calculate blended costs using our HELOC calculator ensuring overall financing costs remain acceptable across combined structures.
Hard money and bridge financing work better for appreciation strategies than cash flow approaches. These short-term loans typically charge 8-12% interest with 12-24 month terms, making monthly carrying costs prohibitively expensive for cash flow strategies depending on monthly income. However, appreciation investors planning rapid sales or refinancing after value-add improvements can absorb these temporary high costs knowing equity gains will repay expensive short-term financing. Hard money loans and bridge loans facilitate appreciation strategies when conventional financing won’t approve aggressive timelines or property conditions.
Tax Implications: How Strategy Affects Your Tax Situation
Tax treatment differs substantially between cash flow and appreciation strategies, affecting after-tax returns sometimes more significantly than pre-tax performance variations. Understanding these tax implications helps you structure portfolios optimizing both financial returns and tax efficiency based on your specific tax situation.
Cash flow real estate generates taxable rental income annually even though much of this income might be offset by deductible expenses and depreciation. Properties generating $6,000 annual cash flow might show zero or negative taxable income when depreciation ($7,000+ annually on $200,000 property), interest expense, maintenance, and operating costs exceed rental receipts. These paper losses can offset other passive income, and in some circumstances, offset active income when you qualify as a real estate professional for tax purposes.
Depreciation benefits both strategies but manifests differently in investor experience. Cash flow investors enjoy depreciation offsetting taxable cash flow—receiving money without current tax liability. Appreciation investors with minimal or negative cash flow use depreciation creating paper losses offsetting other income sources, potentially reducing overall tax burden beyond just real estate income. However, depreciation eventually gets recaptured upon property sales, creating tax liability regardless of whether you’ve received cash flow benefits throughout ownership.
Capital gains treatment upon sale affects appreciation investors more significantly than cash flow investors. Appreciation properties held long-term qualify for favorable long-term capital gains rates (typically 15-20% federal) on appreciation exceeding depreciation recapture. A property purchased for $500,000 and sold for $700,000 generates $200,000 long-term gains taxed at preferential rates substantially below ordinary income rates. Cash flow investors often hold properties indefinitely for income, avoiding capital gains entirely through continued ownership.
1031 exchange strategies allow tax deferral when selling appreciated properties and reinvesting proceeds into like-kind properties. This powerful tool benefits appreciation investors particularly well—selling high-basis appreciation properties in expensive markets and exchanging into multiple cash flow properties in affordable markets transforms accumulated equity into income-generating portfolios while deferring tax liability indefinitely. Calculate 1031 exchange scenarios using our 1031 exchange calculator to understand tax savings and deployment options.
Real estate professional status designation enables active participation losses to offset ordinary income without passive activity loss limitations. Investors spending 750+ hours annually in real estate activities materially participating in their rental businesses can deduct paper losses against W-2 or business income, creating substantial tax benefits. Cash flow investors generating paper losses through depreciation while receiving actual cash benefit enormously from this status. Appreciation investors already showing paper losses from negative cash flow maximize tax offsets against other income sources.
Opportunity Zone investments in designated areas provide appreciation-focused tax advantages—no capital gains taxes on appreciation if properties are held 10+ years. These zones target economically distressed areas offering tax incentives attracting investment. Properties in opportunity zones require longer hold periods aligning with appreciation strategies rather than cash flow approaches targeting immediate income. Research opportunity zone locations in markets where you’re already investing, capturing additional tax benefits through strategic location selection within broader metro areas.
Cost segregation studies accelerate depreciation by reclassifying property components from 27.5-year residential schedules to shorter 5, 7, or 15-year schedules, creating larger early depreciation deductions. Cash flow properties benefit through increased paper losses offsetting cash income, while appreciation properties generate losses potentially offsetting other income. Cost segregation studies typically cost $5,000-$15,000 but can create $20,000-$50,000 in additional first-year deductions on properties $300,000+, providing positive return on investment for many investors.
Mortgage interest deductibility fully offsets rental income regardless of strategy. The interest you pay on investment property financing reduces taxable income dollar-for-dollar, making highly leveraged strategies more tax-efficient than many investors realize. This deduction applies equally to cash flow and appreciation properties, making borrowing costs more affordable after tax benefits than nominal interest rates suggest.
State tax treatment varies substantially affecting after-tax returns differently by location. States like Texas, Florida, and Tennessee impose no state income taxes, making rental income more profitable on after-tax basis than identical properties in California, New York, or New Jersey with 8-13% state income taxes. Factor state tax rates into return calculations—a California property must generate 10-15% higher pre-tax returns than a Texas property to deliver equivalent after-tax performance.
When selecting markets for cash flow versus appreciation strategies, consider both property performance and tax environment. Sometimes lower-performing properties in no-tax states deliver better after-tax results than higher-performing properties in high-tax locations. This consideration affects both where you invest and where you establish residency for tax purposes—some investors relocate to tax-friendly states before building large rental portfolios to maximize after-tax income retention.

Market Cycle Timing: When to Emphasize Each Strategy
Market cycles dramatically affect optimal strategy emphasis—cash flow and appreciation opportunities expand and contract predictably through real estate cycles lasting typically 7-12 years. Understanding current cycle position and recognizing transition signals helps you allocate capital to whichever strategy offers superior risk-adjusted returns at specific timing.
Early expansion phases favor appreciation strategies when markets emerge from corrections or stagnation with renewed job growth, population migration, and housing demand. Purchase prices remain reasonable from recent corrections while appreciation accelerates as demand strengthens—ideal conditions for appreciation-focused acquisitions. These periods typically offer minimal cash flow because rental growth lags price increases initially, but equity gains compensate for temporary negative cash flow as markets heat up.
Peak expansion phases where markets have appreciated substantially for 3-5+ years and price-to-income ratios exceed historical norms signal cash flow strategy emphasis. Expensive markets generate poor cash flow because purchase prices disconnect from rental fundamentals. Shift capital toward cash flow markets that haven’t experienced equivalent appreciation, offering reasonable entry prices with income generation protecting capital if markets correct. Late-cycle market timing benefits from defensive positioning prioritizing income over equity growth.
Correction and recession periods paradoxically create best appreciation opportunities for investors with capital and risk tolerance purchasing distressed properties at substantial discounts. Motivated sellers, foreclosures, and reduced competition allow acquisition below replacement cost. However, these periods require strong reserves and income security since negative cash flow might worsen before improving and appreciation remains uncertain timing-wise. Only pursue aggressive appreciation strategies during corrections if you possess substantial reserves and secure income supporting extended negative cash flow periods.
Recovery transition periods as markets stabilize post-correction but before broad recovery recognition offer balanced opportunities. Properties purchase at reasonable post-correction prices while job markets stabilize and rental demand strengthens. This phase often provides rare combination of acceptable cash flow and appreciation potential—neither strategy produces optimal returns but both generate positive performance simultaneously. Balanced portfolio allocation works well during recovery transitions hedging uncertainty about whether markets will appreciate strongly or stabilize at modest growth.
Interest rate environments affect strategy selection substantially. Rising rate periods compress appreciation returns because higher financing costs reduce buyer purchasing power slowing price growth, while cash flow benefits from reduced competition as fewer investors can afford negative-cash-flow appreciation plays. Falling rate environments accelerate appreciation as improved affordability strengthens demand while reducing cash flow advantages as more investors compete for income properties bidding prices higher relative to rents.
Leading economic indicators provide early signals about market cycle transitions informing strategy adjustments. Monitor building permits, employment trends, wage growth, migration patterns, and housing inventory levels. Building permit surges suggest approaching supply increases potentially moderating appreciation—shift toward cash flow. Employment acceleration indicates strengthening markets supporting appreciation strategies. These indicators provide 6-18 month advance notice allowing strategic capital reallocation ahead of actual market transitions.
Local market cycle analysis matters more than national trends because real estate cycles occur regionally rather than uniformly nationwide. Coastal markets might peak while Sunbelt markets remain in early expansion. Midwest markets might stabilize during corrections while other regions decline substantially. Allocate capital to markets in favorable cycle positions rather than assuming all markets move identically. This requires analyzing multiple markets simultaneously, understanding where each stands in its individual cycle progression.
Opportunistic strategy flexibility—willingness to pursue whichever strategy offers better current opportunities rather than dogmatic adherence to single approaches—maximizes returns across complete cycles. Buy cash flow properties when appreciation markets become expensive. Pivot to appreciation markets when they correct substantially while cash flow markets have appreciated modestly. This tactical flexibility requires capital reserves allowing deployment when opportunities arise rather than being fully invested preventing tactical repositioning.

Your Next Steps: Deploying Your $100K Strategically
Converting theoretical understanding of cash flow versus appreciation strategies into actual capital deployment requires systematic decision-making accounting for your specific financial situation, risk tolerance, timeline, and market opportunities currently available. Follow these prioritized steps to deploy your next $100,000 effectively rather than reactively.
Begin by defining your financial objectives and constraints clearly: do you need immediate income supplementing employment or retirement needs? Are you building toward eventual financial independence through equity accumulation? How long can you sustain negative cash flow if pursuing appreciation strategies? Can you qualify for investment property financing based on personal income or do you need DSCR-based qualification using property performance? These fundamental questions determine whether cash flow, appreciation, or balanced strategies align with your circumstances.
Calculate your actual capital availability beyond the $100,000 deployment amount. How much remains in reserves? Can you sustain negative cash flow on appreciation properties if necessary? What financing can you access? Appreciation strategies require substantial reserves—calculate 12-24 months of potential negative cash flow plus acquisition costs ensuring you have adequate capital supporting aggressive strategies. Cash flow strategies need less reserve depth but benefit from larger acquisition capital allowing multiple property purchases diversifying risk.
Research specific markets thoroughly rather than pursuing generic “cash flow markets” or “appreciation markets” based on dated lists. Current market conditions change—yesterday’s cash flow havents might have appreciated substantially reducing cash flow potential. Use current rent-to-price ratios, appreciation trends, job growth, and inventory levels evaluating specific neighborhoods within target markets. Connect with local real estate agents, property managers, and other investors gaining ground-level intelligence about actual conditions versus published statistics.
Model complete financial scenarios using our rental property calculator before making offers on any properties. Input actual purchase prices, realistic rent estimates, real property taxes, actual insurance quotes, and conservative vacancy assumptions calculating true cash flow or negative cash positions. Then project appreciation at conservative, moderate, and aggressive rates understanding total return ranges across scenarios. This analysis prevents surprises after closing when actual performance differs from optimistic projections.
Get pre-approved for investment property financing before identifying specific properties. Understanding your purchasing power, available loan programs, rate pricing, and reserve requirements prevents wasted effort analyzing properties you can’t actually finance. DSCR qualification based on property income works well for cash flow strategies while conventional income-based financing might be necessary for appreciation properties without immediate positive cash flow.
Start with single property acquisition mastering operations before attempting rapid scaling. Even experienced active investors entering new markets benefit from learning regional dynamics, building local professional teams, and understanding actual versus projected performance before deploying remaining capital. Use your first acquisition as education about that market and strategy, informing subsequent investment decisions with real experience rather than theoretical assumptions.
Build professional teams in target markets including real estate agents specializing in investment properties, property managers with rental portfolios you’re targeting, contractors for repairs and renovations, insurance agents providing investor policies, and real estate attorneys familiar with landlord-tenant law. These relationships prove more valuable than property selection—professional operators often overcome poor property performance through excellent management while amateur operators destroy potentially good properties through poor operational execution.
Consider starting with cash flow strategies regardless of long-term appreciation strategy interest. Immediate positive cash flow provides psychological reinforcement when facing challenges inevitable in real estate investing, generates funds for additional acquisitions accelerating portfolio building, and develops operational competence applicable to any property type or market. After establishing cash flow foundation and building confidence through experience, expand into appreciation strategies requiring longer timeframes and more sophisticated risk management.
Schedule a call to discuss financing strategies specifically aligning with your cash flow versus appreciation approach. Different loan programs suit different strategies—understanding which financing structures optimize your specific plans prevents using inappropriate products that hinder rather than help your investing objectives. Financing represents the largest expense in real estate investing, making optimal product selection crucial to success regardless of strategy emphasis.
Execute your first investment in the next 90 days rather than perpetually researching perfect opportunities. Analysis paralysis prevents more investor success than poor market selection. Markets continuously offer opportunities—someone purchased properties profitably during every market cycle including peaks generally considered poor timing. Your execution, financing structure, operational competence, and long-term holding capacity matter more than perfect market timing or strategy selection. Deploy capital systematically with reasonable caution rather than seeking perfect clarity that never arrives.
Real estate wealth building occurs through sustained action across market cycles—not perfect strategy selection or timing. Whether you emphasize cash flow, appreciation, or balanced approaches matters far less than systematic capital deployment, conservative underwriting protecting against downside, adequate reserve maintenance, and patient long-term holding allowing real estate’s wealth-building mechanisms to compound over years and decades. Your next $100,000 represents not a single investment decision but the beginning of systematic portfolio construction continuing throughout your investment career.
Frequently Asked Questions
Can a single property provide both strong cash flow and appreciation simultaneously?
Properties delivering both strong cash flow and robust appreciation are rare—they exist primarily during market transitions when recovering areas haven’t yet been repriced by investors. Most commonly, markets favor one dimension or the other due to fundamental dynamics: affordable markets with strong rent-to-price ratios generate cash flow but limited appreciation, while expensive growing markets deliver appreciation but tight or negative cash flow. However, individual properties in transitioning neighborhoods within appreciation markets sometimes provide temporary dual benefits. Properties purchased below market value through off-market acquisition, distressed sales, or seller financing also might deliver both benefits regardless of broader market characteristics. Focus on creating dual benefits through acquisition strategy—buying well—rather than expecting markets to deliver both benefits consistently. Use our investment growth calculator to model various scenarios understanding trade-offs between immediate income and long-term equity growth.
How do I know if I’m buying in a cash flow or appreciation market?
Calculate rent-to-price ratios comparing median property prices to typical monthly rents—cash flow markets generally exceed 0.8-1.0% monthly (a $150,000 property rents for $1,200-$1,500) while appreciation markets fall below 0.5% monthly (a $600,000 property rents for $3,000 monthly). Review historical appreciation rates over 10+ year periods—appreciation markets average 5%+ annually while cash flow markets trend 2-4%. Analyze price-to-income ratios dividing median home prices by median household income—ratios below 3-4 suggest cash flow markets while ratios exceeding 5-6 indicate appreciation markets where prices have outpaced income growth. Research job market composition and wage trends—high-income professional employment concentrations drive appreciation while diversified moderate-income employment bases support cash flow. Connect with local property managers asking about investor demand, cap rate expectations, and whether most investors target income or equity growth. These combined indicators reveal market characteristics more accurately than any single metric.
Which strategy makes sense for someone approaching retirement in 10 years?
Investors within 10 years of retirement should emphasize cash flow strategies increasingly as retirement approaches, systematically transitioning appreciation-focused holdings into income-generating properties through strategic sales and 1031 exchanges. Start with 60/40 cash flow/appreciation allocation at 10 years before retirement, shifting to 80/20 at 5 years out, and targeting 90/10+ entering actual retirement. This progression builds monthly income replacing employment earnings while reducing market cycle exposure and negative cash flow obligations. Consider using refinancing on appreciated properties to extract equity deploying into cash flow markets rather than selling, especially if you hold low-interest-rate financing you want to preserve. However, avoid over-leveraging near retirement—cash flow strategies work best with conservative leverage (30-40% initial capital, not maximum 20-25%) ensuring stable income even during vacancies or market challenges. Calculate income needs precisely understanding how many cash-flowing properties generating what monthly amounts you require replacing employment earnings, then work backward determining acquisition pacing reaching those quantities before retirement.
Can I convert appreciation properties to cash flow properties without selling?
Converting appreciation to cash flow typically requires either market maturation where rents catch up to prices through time, strategic refinancing if you hold high-interest debt that can be improved, or operational improvements increasing rental income without proportional cost increases. Markets do eventually mature—yesterday’s appreciation plays become today’s cash flow properties as rents gradually increase while property values stabilize. However, this conversion might take 5-10+ years depending on local dynamics. Alternatively, if your property remains mortgaged at high rates (7-8%) but market rates have decreased, refinancing reduces monthly payments potentially converting negative or break-even cash flow to positive. Operational improvements like adding parking, storage, appliances, or amenities justifying rent increases also can improve cash flow, though most appreciation markets have competitive rental markets limiting improvement potential. The most reliable conversion path involves patient time—holding properties through complete market cycles until rents rise sufficiently generating positive cash flow at then-current valuations. This approach requires maintaining reserves sustaining potential negative cash flow periods until conversion occurs naturally.
Should I ever pursue appreciation strategies if I need monthly income?
Generally avoid pure appreciation strategies if you depend on monthly real estate income for living expenses—negative cash flow properties consume capital rather than generating income, creating financial stress when you need income support. However, balanced approaches combining majority cash flow properties (70-80% of capital) with modest appreciation exposure (20-30%) allow some equity growth participation without jeopardizing income needs. Alternatively, pursue appreciation properties only with capital earmarked specifically for wealth building separate from income-generating portfolio, maintaining strict separation ensuring income properties fully fund lifestyle needs before deploying additional capital to appreciation strategies. Some investors use employment income or other businesses funding living expenses while building appreciation-focused real estate portfolios for wealth building, then transition to cash flow strategies later when employment income ends. This lifecycle approach emphasizes growth during high-earning years and income during retirement years, aligning strategies with changing financial needs. Never finance appreciation strategies creating negative cash flow using credit cards, home equity lines, or other expensive debt—this approach creates financial fragility threatening both your real estate holdings and personal financial stability.
Related Resources
Also helpful for active investors:
- How to Scale Your Real Estate Portfolio — Systematic growth strategies across multiple markets and property types
- Geographic Diversification for Real Estate Investors — Managing properties across multiple markets and regions
- The BRRRR Method Explained — Forced appreciation strategy accelerating equity building
What’s next in your journey:
- Advanced Portfolio Analysis for Real Estate Investors — Sophisticated metrics tracking portfolio performance
- When to Sell Investment Property vs. Hold — Exit timing and portfolio optimization decisions
- Building Generational Wealth Through Real Estate — Long-term legacy and wealth transfer strategies
Explore your financing options:
- DSCR Loan Program — Income-based financing ideal for cash flow properties
- Portfolio Loan Program — Multi-property financing for diversified investors
Bank Statement Loan Program — Alternative documentation for self-employed investors